Seasonal Charts in the Forex Market: Best and Worst Times of the Year to Trade
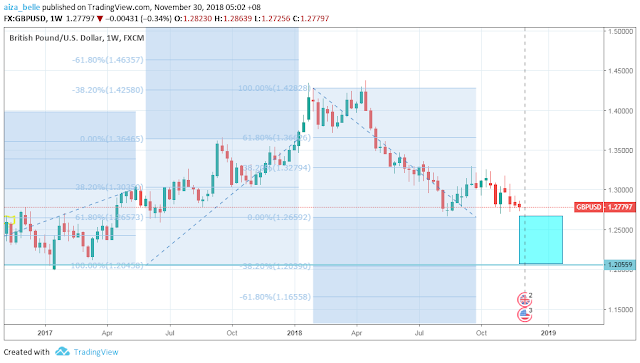
And why GBPUSD can drop further to 1.25 (if not 1.20) by the end of this year, regardless of a deal or no-deal Brexit.
Ooof.
Update 1/2/2020: Latest FX Seasonality Charts for 2020 are now available here.
Unlike in futures and stocks where seasonality is more obvious with harvest timing, holiday prep and tax season, I used to think that it's almost non-existent in FX markets because there are way more factors influencing them simultaneously. Add the fact that you trade FX in pairs, so it gets trickier.
I was wrong.
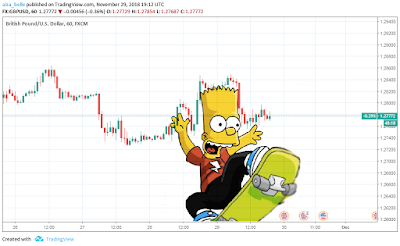
I've just started looking into the seasonality of FX pairs recently after the "significant amount of statistics" part in this good old inspirational thread reminded me to do so, and see if I can add it in my screener for weekly watchlist, and also help me "predict" where the price will head next regardless of these noise, when price action gives nary a sign, and charts show nothing but either dojis tip-toeing on S/R levels, or simply Bart Simpson.
 |
| What am I doing on my free time? |
Back to seasonal charts.
Seasonal charts shouldn't be used alone though, and should be treated as an additional confirmation in whatever strategy you're using: price action, indicators or good old fundamentals (this actually works best on swing trading).
Since the market situation before the internet era as well as the subprime crisis is way different from what it is now, I thought it makes more sense for me to only cover the most recent 10 years.
AUDUSD Seasonality
It's possible for AUDUSD to reach 0.75 by the end of the year. This pair usually goes bearish before summer time then bounces back, only to go bearish again by August and starts recovering by year end.This year, AUDUSD seems to start recovering already in November from its slump earlier this year. Whatever the outcome of the Trump-Xi meeting will surely have a huge impact on the Aussie, however I don't think it's gonna be strong enough to make this pair gap and jump past 0.745 at least before the end of this year.
We'll see.
EURUSD Seasonality
EURUSD's volatility is somewhat muted during the early half of the year, but starting August, oh boy! Only to start going south right after Halloween.However this year, this pair already started sliding down even before Halloween season because of a combination of scarier things: Italian Budget Crisis and Brexit. The "seasonal optimism" around August and September seemed to prevent this pair from breaking the current support at 1.13. I think it's gonna go ranging between 1.13 and 1.15 next month.
But the moment that 1.13 support breaks, it's highly likely that EURUSD can drop back to its 2017 low at 1.05.
GBPUSD Seasonality
GBPUSD goes bearish at the start and end of the year, with some recovery and more volatility during the first half of the year, before going flat and zzz during summer months, then wake up a little sad by September.Based on its seasonality alone, it's more likely that this pair will continue to go bearish before UK officially leaves the EU by March 29, 2019. After that, during its transitional phase, GBPUSD might experience a rally.
Either this pair drops to its 2017 low at 1.20 this month or by January next year.
NZDUSD Seasonality
AUDUSD and NZDUSD almost share the same seasonality, except the former starts recovering and going bullish early by end of the year, while the latter lags a bit and recovers in the beginning of the following year.Since this pair went down earlier than expected last April (thanks to the trade slap fight between Trump and China), it seems to be recovering earlier too and I think it will continue to do so until it touches the nice 0.70 psychological number before bouncing back down and lingering some more at around 0.68 (2017 low).
USDCAD Seasonality
USDCAD goes bearish at the beginning of the year, and around April, then for the most part of the year, it trends up.Since this pair seems to be starting to form a double-top in the weekly charts lately, there's the expected oil production cut this December, and considering its seasonality as well, there's more likelihood that it will drop to at least 1.31 by the end of the year.
However, if Saudi Arabia and Russia won't push through with the planned production cut, and with the US pumping oil without any care about what OPEC says (yasss! Thank you btw), then it's possible that the whales will jack this loonie cross up to 1.35 resistance between now and March next year.
USDCHF Seasonality
USDCHF's direction depends not only on the momentum of DXY, but also how risk averse or not the market is. Since CHF is considered a safe haven, the market seems relatively conservative with varying degrees of risk aversion for the most part of the year-- except a month before summer and few months before the Christmas holidays, with May, October and November on the green.
This pair seems to be already on its way downward few weeks after touching the psychological price point at 1.00. Considering that, its seasonality in December, the current general risk off sentiment because of G20 meetings, upcoming Fed rate hike and defensive stance when it comes to equities, there's strong likelihood that this pair will drop to 0.98 by the end of the year.
USDJPY Seasonality
Like USDCHF, USDJPY gains or loses appeal depending on how risk averse the market is. It's like the "smoother" version of the swissie cross, however the yen is more preferred by most investors as a safe haven than the swissie since the aftermath of the subprime crisis back in 2008 (and also when there's risk in the Eurozone). Based on its seasonality below, this pair goes green during the later part of tax season and near the Christmas holidays.
Since again, the markets now are risk averse lately and add the fact this pair is already near the weekly resistance at 115, it's less likely that this pair will jump past that price level within the year even if its seasonality for December suggests bullishness.
More likely USDJPY will go down back to 110, though not right away. Probably by 1st quarter next year.


Hello, I would like to appreciate your work. It’s a great platform got to learn a lot. Your data is really worthy. Thank you so much. Keep it up!
ReplyDeleteForex Trading
Forex Market